
Does market price optimization make sense in private EV charging?
Private charging and especially home charging accounts for the majority of charged power to vehicles, but what can we find out by looking at private charging data and is there a lesson about energy management?
Recent world developments have changed the discussions we have with customers.
In the past, talking about energy management with customers had a pattern. Everyone was interested – the concept was interesting: lower costs through peak shaving, market-optimized charging and local production integration; more revenue from participation in demand response markets. But the time was never now. Everyone was sure eventually we'd get to it, but now was the time to focus on increasing volume, network presence and sites for future expansion. The time for optimization would come- later.
Then the pattern changed.
The changed pattern begs the question: how beneficial to profitability and detrimental to user experience would some level of price optimization be? Private charging is an obvious candidate as in public charging the driver's expectation is often to get the full power in a short period. In private charging, the expectation is that the battery will be full by when leaving, often after several hours.
Let's take a look at some basics first. The following figures are based on private chargers connected to the eMabler platform, mostly in Norway.
- For private charging, the mean transaction length is about 18 hours. That's long and explained by a relatively large number of vehicles being left connected to the chargers for a long period, especially over weekends.
- A home charging driver charges their vehicle every 3 days for about 19kWh / charging session. This is a little less than we expected (we expected about 25kWh / charging session, based on average power consumption and daily drive length). The discrepancy may be explained by either:
- Drivers charging at work or public chargers in a network where we can't attribute the transaction to the same driver or
- The drivers in our network mostly drive in cities (which is true), where power consumption is lower due to shorter driving distances.
- Our private charging customers delivered about 1.45 GWh of power in the last 30 days
Let's then take a look at some external data for a change. The following graph shows normalized price curves for three energy markets, called bidding zones: Norway's BZ 1 around Oslo, BZ 3 around Trondheim and our home bidding zone encompassing Finland.
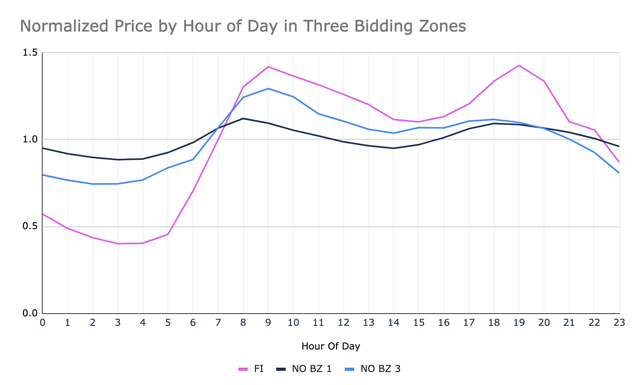
The prices displayed are calculated by taking the last 12-month average of the day-ahead market price for each hour of the day, and normalising to the mean of the hour-long buckets for each zone. The graph shows pretty clearly, that the peak prices occur in the morning between 0700 and 1200 local time and around 1700 and 2000 in the evening. The volatility of energy prices varies greatly between bidding zones, but looking at the normalized variation does not give the whole truth. The table below shows how much money would be saved / MWh consumed if all charging from the 8 highest peak hours would be pushed to the 8 lowest cost hours.
| Cost / MWh | FI | NO BZ 1 | NO BZ 3 |
|
8 high hours
|
555 € | 594 € | 108 € |
|
8 low hours
|
227 € | 497 € | 70 € |
|
Saving potential
|
329 € / MWh | 97 € / MWh | 37 € / MWh |
While the sums may not sound like much, EV charging consumes a lot of power. As noted before, our private charging Charge Point Operator i.e CPO-customers delivered more than 1.45 GWh to drivers in the last 30 days, but how much of that falls into the high-cost hours? Here's a nice graph about active charging sessions over time. The colours pink, light blue, and navy indicate high, medium and low-priced hours respectively.
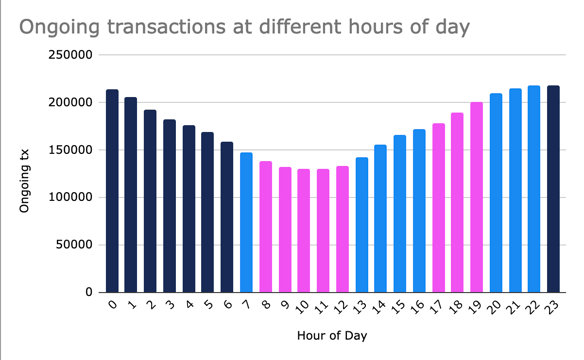
The answer, it turns out, is that about 18% of all charging transactions are active during high-cost hours. In particular, throttling the evening hours will very effectively push demand to lower prices during the night, with very little end-user impact. All told, the savings potential for our private charging customers in the Norwegian zones would fall between 9-25k€ every month. For the Finnish bidding zone, the same chargers would amount to a whooping 85k€ monthly.
The table shows the savings potential for a hypothetical private charging operator, with 1.45GWh of delivered power in one bidding zone:
| FI | NO BZ 1 | NO BZ 3 | |
| Energy cost | 196 248 € | 263 487 € | 42 881 € |
| Savings potential | 35 325 € | 47 428 € | 7 719 € |
| Savings potential % | 44% | 10% | 23% |
It's not likely all this could be realized in practice – people need some power during the peak hours too - but throttling charging by 50%, for example, would not be unreasonable for home charging – the long transaction length will result in the car being ready by morning anyway.
Unlike public charging, private charging is a very suitable candidate for various energy optimization measures. The practical effects on drivers can be minimized, reducing costs and even making electric vehicles greener.
As it is evident that energy management plays an important role in optimizing the service in private charging, and the need for sophisticated management will be more important as new parameters (local production, storage, peak shaving, demand response etc.) are thrown into the formula. Therefore, eMabler is focusing on energy management in EV charging and we have published a market price-optimized charging (Spot) feature on our platform.
You can expect to hear more from us on the subject in the future.

COMMENTS